

CCM (Part 5) - 5 things you should know - and 2 things you better not forget - when building a CCM data analytic environment
This post is part five of a bigger article which is titled “5 things you should know - and 2 things you better not forget - when building a data analytic environment”. It is about data analytics in general, but with a focus on building bigger solutions like a CCM (Continuous Controls Monitoring Environment). The full article contains of several parts. The first five describe attention points that you should be aware of:
- Know what you want to know (aka list analytic questions)
- Know your systems (aka identify data sources)
- Know your data (aka examine data structures)
- Know your Analytic Tools (aka understand technical possibilities and limits)
- Know your customers (aka think about who receives the results and what they will do with it)
Part six and seven are about two things that you probably already know, but we emphasize their importance in the context of data analytics:
Part 1-4 have already been covered (they are linked above, so you can go back anytime there). This is now part 5, “Know your customers”:
Five things you should know, continued (5/5)
We do continue with the fifth aspect out of the five things that I see as “essential”. The first step, labeled “Know what you want to know”, was about a getting proper business understanding and stating as-detailed-as-possible questions that can actually be answered. Only by knowing your business well you can make a good list of analytic questions. The area we were interested in was “Compliance”, the topic “Payments to critical countries” and the detail questions that were raised we stated as follows:
- “Identify payment transactions that have been done in context of partners like vendors, or customers, or even where an expense account is directly debited.
- Create a list of these transactions and identify the payee’s bank country for those payments.
- Match these detail transactions versus a list of countries that are seen as critical because they are on the embargo list, known as tax haven or having a Corruption Perception Index > x.”
In step two we talked about the importance to “Know your systems”. We found out that our payment data is on an SAP® system “SY2”, running SAP® ERP ECC 6.0, and containing the financial transactions for all companies worldwide.
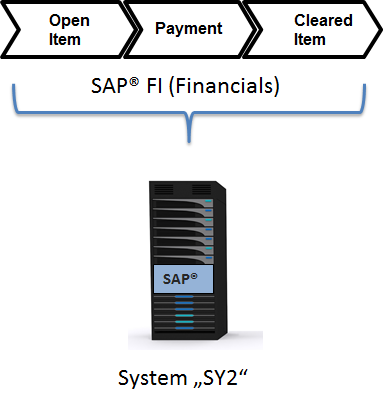
Picture 1 – Identifying the correct system
Based on that we found out about the data ownership and then followed the process of requesting a user with appropriate read-only rights to access the data.
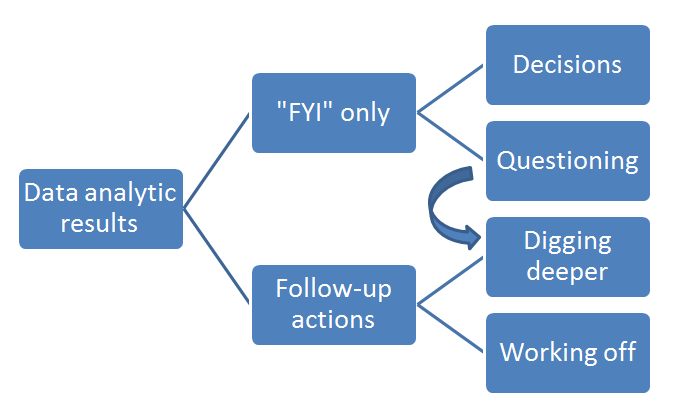
What data actually is necessary, we discovered in chapter “Know your data”. We went from identifying the tables to finally identifying fields and understanding the logic and relations between the tables. Part of that was an explanation of different techniques how to find the data, and the top down approach. We ended up with a list of tables and fields, which for our example could look like this:
| Element / Process steps | Table | Field(s) | Comment |
| Vendor master data | LFA1 | LIFNR | Vendor number |
| Vendor master data | LFA1 | LAND1 | Vendor country of residence |
| Vendor bank accounts | LFBK | LIFNR | Vendor number |
| Vendor bank accounts | LFBK | BANKS | Vendor bank country |
| Customer master data | KNA1 | KUNNR | Customer number |
| Customer master data | KNA1 | LAND1 | Customer country of residence |
| Customer bank accounts | KNBK | BANKS | Customer bank country |
| Customer bank accounts | KNBK | KUNNR | Customer number |
| Payment run transactions | REGUH | LIFNR | Vendor number |
| TPayment run transactions | REGUH | KUNNR | Customer number |
| Payment run transactions | REGUH | LAND1 | Vendor country of residence |
| Payment run transactions | REGUH | ZLAND | Payees country of residence |
| Payment run transactions | REGUH | ZBNKS | Payees bank country |
| ... | ... | ... | ... |
Picture 2 - Examine data structure: Table and Field list
We know the question, we know where the data for the answer is stored and we are also aware what data is necessary. The attention points regarding the tools for data extraction and the analytic tool are defined as well. The most important aspects are listed in the following checklist:
| Data Extraction Tool | Data Analytic Tool |
| Mass data capability | Mass data Capability |
| Performance | Performance |
| Read-only access | Read-only access |
| Delta-Downloads | Client/Server capability |
| Automization | Automization |
| Usability | Usability |
| Correct target formats | Transparency |
| Data privacy | Content |
| Output formats |
Picture 3 - Checklist for data extraction and analytic tool
At the end of part four of this series, we briefly discussed the meaning of having different output formats. As you may get different requirements from different types of “result consumers”, certain flexibility is important.
You have a manager who only needs KPI information; on the other hand you have an accountant who should look up the details. Which types of result consumers you might encounter, and what this means for our example scenario of “Payments to critical countries” will be looked at in detail now:
Aspect 5: Know who are the "internal customers"
To start we will describe the potential process of working with data analytic results and its technical aspects. We will use this to approach to the “customers” (you could also say, “Audience”) which we might encounter, and label them.
The base for this is still our analytic question „Payments to critical countries“, which creates a table of outgoing payments and matches those with a list of countries that are potentially critical. As this will happen in context of a CCM project, this test will be run regularly (for example on a weekly base).
When it comes to the results that are generated, at least two questions arise:
- What to do with the results?
- What datasize is expected?
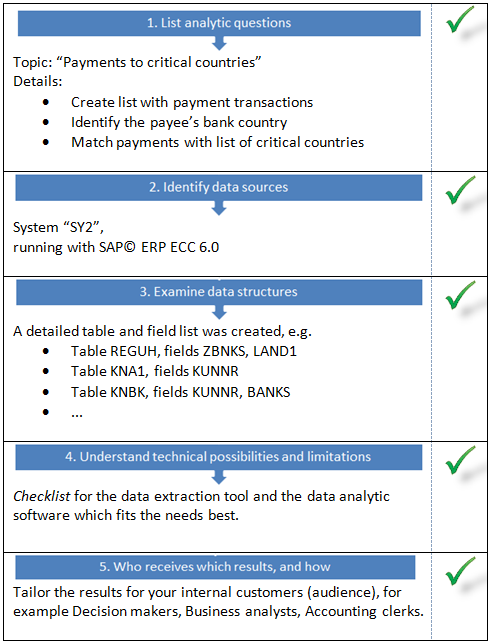
The results could be used solely as „FYI“, and/or as initial point for follow-up actions. These follow-up-actions could be only „descriptive“, or a pile of tasks that actually should be worked off.
Picture 4 – How to proceed with the results
If the focus is on the „FYI“ aspect, then usually a pretty abstract level is enough for generating an overview. If 263 single payment transactions happened last week, usually those do not need to be listed in detail. It can be enough to state that “In calendar week 12 in total 263 payment transactions (out of 12.571, so 2.09% of count) to bank accounts in critical countries were recorded with a critical payment volume of 6,4 Million Euros (of a total of 639,9 Million Euros, so around 1,00% of value).” If this information is put on a timeline for every week, meaningful high-level diagrams can be created based on that. But maybe, in certain constellations, questions may arise that need to be addressed (see “Questioning” in picture 4).
If however the data analytic results are the base for follow-up actions, those actions can be analytic ones or operative ones.
“Analytic” (this is labeled in picture 4 as „Digging deeper“) means that the 263 single payment transactions to critical countries are used as base for more in-depth analytics: Who received the money, was it a customer, a vendor, a partner company, employees or a public sector institution? What cost category had been assigned to those liabilities in accounting?
“Operative” means that each single result record actually gets processed and needs to be ticked off (“Working off” in chapter 4). In our example, for each one of the 263 payment transactions the person who was responsible will need to be identified and the compliance of that business transaction needs to be checked and documented. Only when this is finished, that record gets ticked as “done”.
OK, so we have an understanding of the first point regarding the question “What to do with the results”. The second point “What data size is expected?” may in fact influence that. If the intention is to use the results “FYI only” then it will be irrelevant for if there are 263 or 2630 results in that result set – it will be summarized to one or two sentences anyway, and that’s it. For the aspect of “digging deeper” this should not be a problem as well; it only has an impact once the result size is bigger than one a standard tool like Microsoft Excel™ actually is able to handle. In that case we still have the option of use our analytic tool here, with which we might be better off for the ad-hoc analytics anyway (Remember: The ability to deal with mass data and good usability were two of the criteria).
The biggest impact of a huge result set will be for the „Working off“ aspect.
It is difficult (if not impossible) to have an accounting clerk checking thousands of transactions in detail – keep in mind that new ones will come in every week, as this happens in a CCM environment. In such cases there will be the need for limiting the results. This can happen by filtering it afterwards, and only look at transactions over a certain monetary threshold. It is a matter of taste whether this happens upfront and gets implemented in the analytic logic already, or afterwards when looking at the result.
How to proceed with the results usually is not an either/or decision. Depending on organizational structure or internal processes often all of the approaches listed above are necessary. This leads us to the different types of (internal) customers. To keep it simple, we differ between three main roles of analytic result consumers:
- Manager / Decision Maker
- Business Analyst
- Accounting clerk

Picture 5 – Three types of internal "customers" (audience)
- The Manager / Decision maker needs information on C-level. The results must enable him to identify trends, recognize and evaluate risks and anomalies and make decisions based on that. Usually he needs a bird’s eye view on the topics.
- The Business Analyst uses the detail records of the results as well, plus uses summarized information. He creates, sometimes based on the demand of the manager, additional aggregations and consolidations. Similar to a controller he answers various questions on and around certain topics, but with a wider focus than just internal and external financial aspects. “Why do we have a peak of critical transactions in week 10?“, „Does the result reflect the structure and global allocation of our vendors and customers?“ “Is the increasing volume caused by only a few but highly material transactions, or is the count of payment transactions increasing in general?” All these questions can be answered by the business analyst. Standard questions can already be part of the automated CCM analytics, others he might need to do ad-hoc, based on demand.
- The Accounting Clerk mainly works on detail level. He double-checks the paper documentation, audits the authorizations if all has been signed correctly. To do this he usually needs a lot of very specific information.
So there are different ways how to deal with the results, and there are different people on different levels working on those. This leads us to the technical aspects: Now that we do know the „internal customers“ and their different approaches how to use the results, we can tailor the scope and layout or format of the results for them:
| Result consumer | Graphics | Detail level | Tools |
| Decision Maker | Solely | Birds view perspective | Dashboard |
| Business Analyst | Partly | Summarizes and Details | Analytic tool |
| Accounting Clerk | No | Detail level | Exception Management, Excel |
Picture 6 - Result consumer overview
As we now know about our „internal customers“ (audience), we should apply the rule of thumb „Reduce to the max“ (A marketing slogan of Mercedes-Benz for the SMART) when creating the results.
Our audience needs to get all relevant information which allows them to proceed and use the results as intended. However “information overkill” needs to be avoided, which sometimes is not so easy in times of “Big data”. The best idea is probably to put yourself in the position of the different customers types and think through how they have to work with the results:
- Would the decision maker only receive the statement “In calendar week 12 in total 263 payment transactions to bank accounts in critical countries were recorded.“ he would ask immediately “What money are we talking about here? ” So it is always a good idea to add the materiality, for example: “In calendar week 12 in total 263 payment transactions to bank accounts in critical countries were recorded with a critical payment volume of 6,4 Million Euros.” Also, adding ratios can be a very useful thing, and helps to understand what part of the total count and monetary amount of the transaction is concerned: “In calendar week 12 in total 263 payment transactions (out of 12.571, so 2.09% of count) to bank accounts in critical countries were recorded with a critical payment volume of 6,4 Million Euros (of a total of 639,9 Million Euros, so around 1,00% of value).”
- The Business analyst needs additional contextual information in his data. What is the country of residence of customers, vendors and partners? What cost types have been assigned to these transactions? If this is provided, he can perform additional in-depth analytics ad-hoc.
- To enable the Accounting Clerk to look up a financial document in SAP®, he needs to have detailed information about company code, fiscal year and document number. He can then directly look at that document, and maybe he is able to access a PDF attachment from that starting point which is stored in the optical archive.
Bottom line: “Correct output” does not automatically make a “good result”. A good result gets created by tailoring the correct output for the target audience. To be able to do this, that audience needs to be identified upfront.
If we take our 5 things as checklist, currently we managed to solve all five steps:
Picture 7 – The progress we made so far
Now that all five prerequisites are covered, we “only” have to implement the CCM project. In the next (and probably last) part of this series we talk about two things that you probably already know, but they are so important that we need to have a closer look at them:
- There is a price tag to it (aka budget)
- You need someone who can do it (aka resources)
I hope you enjoyed this forth part of our CCM articles! For any comments or questions, feel free to write us at info@dab-gmbh.de.
To contact the author you can also use LinkedIn or XING (you may have to login first before you can access these links).
LinkedIn: http://de.linkedin.com/pub/stefan-wenig/54/1b8/b30