

Using SAP® reports for data analytics by the example of customer balances
Often when giving a training or doing consulting in context of data analytics, people are asking me about whether there are existing SAP® reports, which can make their data analytic life easier. This question is a valid one indeed, as any SAP® release usually offers a wide range of built-in reports which deliver information just by the push of a button. However I want to point out by the following example that only “pushing the button to run the report” is not just sufficient, at least not if you want to (or need to) explain and fully understand (or even to reproduce) the result. Interpretation requires context and knowledge about the data you are looking at, and no report will relieve the data analyst from his responsibility to understand the reports output.
In this article I will use a report to display customer balances. I will show how to run it in SAP®, we will have a look at the result together and then we will reproduce the reports output based on the detail transactions.
Starting point
When performing an audit (or analyzing data in general) a common task is getting an overview about the business we have with a certain business partner (like customers or vendors). An important part of this is analyzing the customer balances (also called “transaction figures”). The following approach is based on a SAP® Training system.
Listing customer balances by using report S_ALR_87012171
One way to retrieve the customer balances would be to browse the SAP® navigation tree looking for existing reports. Some relevant reports can be found for example by clicking your way through “Accounting -> Financial Accounting -> Accounts Receivable -> Information system -> Reports for Accounts Receivable Accounting -> Customer Balances” (phew, that was quite a long way to go…):
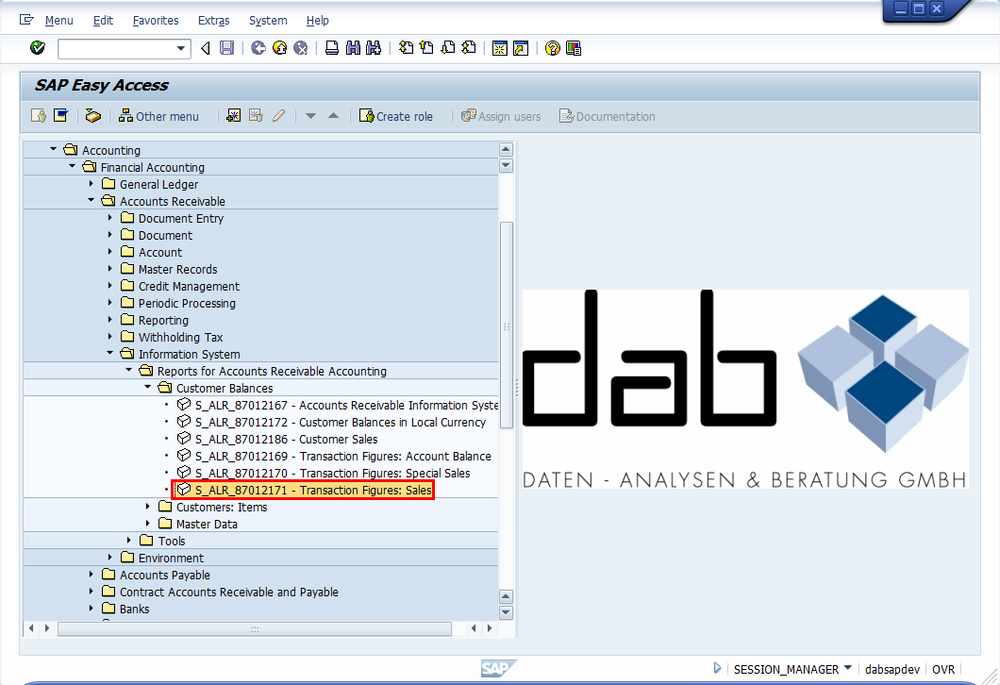
Figure 1 – Finding appropriate reports using the SAP® navigation tree
In this article I want to use report “S_ALR_87012171 – Transaction figures: Sales“ as example. Please note that on your system you might have other or different options, which may provide even better ways to answer our “Customer balances” question. However for making my point about the necessity of having know-how to understand or even reproduce the results, this example is sufficient. Running the report requires some parameters. I used the values „Customer Account = 1033“ and „Fiscal Year = 2005“ and „Company Code = 1000“, as the training data is a bit outdated already.

Figure 2 – Relevant parameters for Report S_ALR_87012171
Running the report with the parameters listed above provides as result the customers “turnover” split into 16 single lines – these are representing the 16 fiscal periods which do exist in SAP® Financials.

Figure 3 – Total customer turnover split per posting period
This reads as follows: In fiscal year 2005, we had turnover with that customer in the first eleven posting periods 1-11, which means January until including November. The first line contains a turnover of 153.271,57 Euro (the selected company code uses Euros as local currency), and the total turnover for the whole fiscal year is 2.395.751,99 Euro. Now we will try to reproduce that based on the single transactions, using the first posting period of January as example.
To drill down you can place the cursor in the cell you want to get the details for, then go to the menu and select „Goto -> Line Items”. This lists the single financial customer documents, which are (supposedly) adding up to the total amount in January.
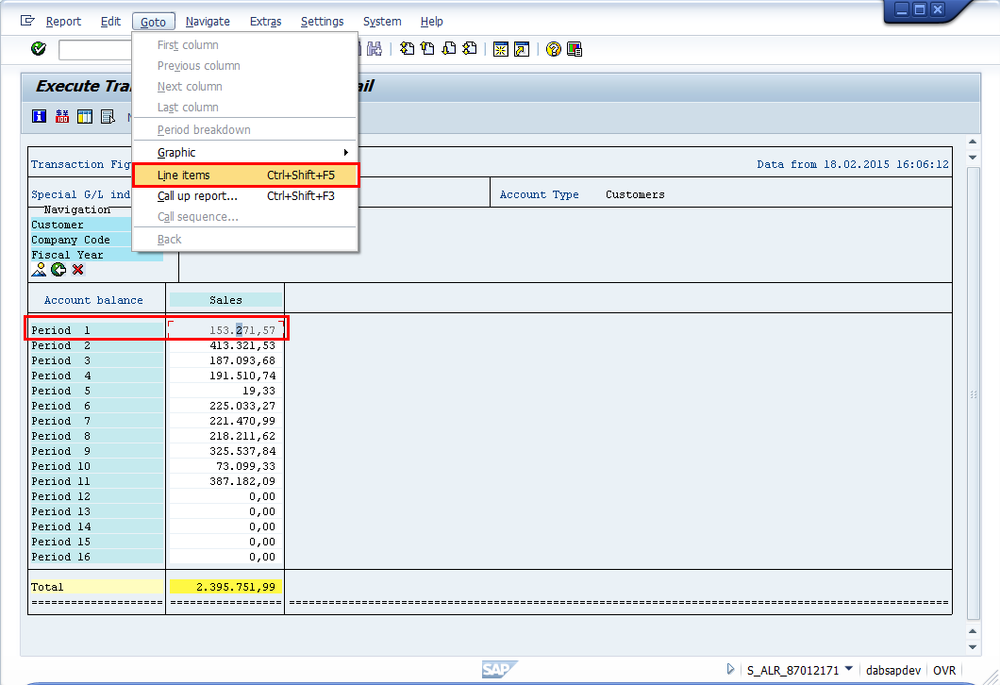
Figure 4 – Drill down to see the line items
But having that result, can we reproduce the total value accordingly? In our detail screen we have open items (marked red) and cleared items (marked green). Credit postings are listed as negative amount (with a minus in front), debit postings positive. But how does it add up to 153.271,57 Euro?
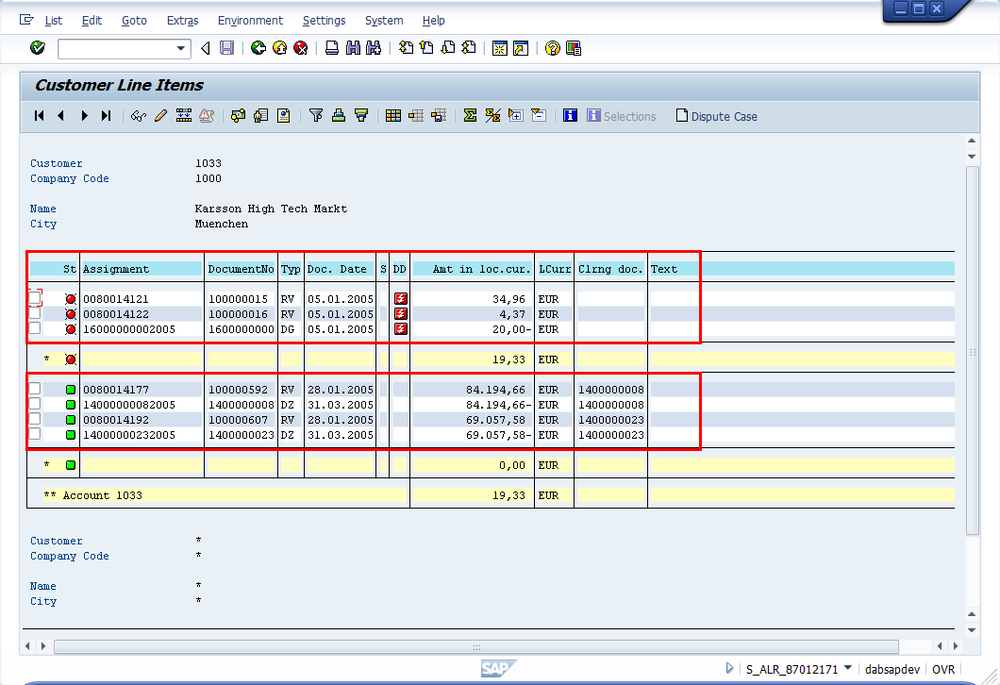
Figure 5 – Relevant customer financial line items
By going to „List -> Export“, I can download the data to my laptop using Microsoft Excel™ format to make calculations easier. SAP®s built-in spreadsheet extract is not very eye-kind and nice to look at, so I formatted the spreadsheet a bit, making it more handsome.
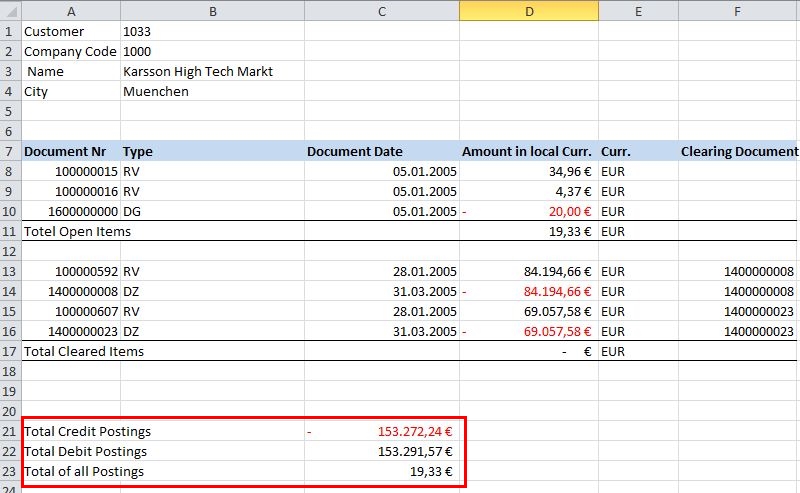
Figure 6 – Reproducing the totals (1)
The data is the same as in the SAP® screen, with open items on top followed by the cleared customer items below. Credit postings are negative and in red font, debit postings in black font. Additionally, I created three checksums:
- Total Credit Postings: -153.272,24 Euro
- Total Debit Postings: 153.291,57 Euro
- Total of all Postings: 19,33 Euro
Applying some basic accounting knowledge we could assume, that invoices sent to customers will be posted on the debit side of the customers „T-Account”. However, adding up all debit postings - and also, none of the other checksums – matches with the turnover of 153.271,57 Euro we received by running our report in the first place. What could be the reason for that?
SAP® is taking only „sales relevant“ customer line items into account when computing the total value. These are for example invoices, but not payments. Payments are only relevant for the Cash-Flow, but not for the customers sales figures. Having a closer look at the customer line items in SAP®, payments from customers do have document type “DZ” (for DebitorenZahlung, which is German for Customer Payment). They need to be excluded when totaling the values. Invoices have document type “RV”, and SAP® uses those lines for creating the totals – but not only those lines. Credit notes are affecting our turnover as well – they in fact lessen the turnover figures. Credit notes can be issued because of bonus agreements, or because of crediting something for bad quality or underdelivery. In our example we do have a credit note, indicated by document type “DG” and it got subtracted from the total invoice amount. This means, totaling all invoices leads to an amount of 153.291,57 Euro, minus the credit note of 20,00 Euros results in a final customer turnover of 153.271,57 Euro.
I adjusted the spreadsheet slightly by highlighting the relevant lines green.
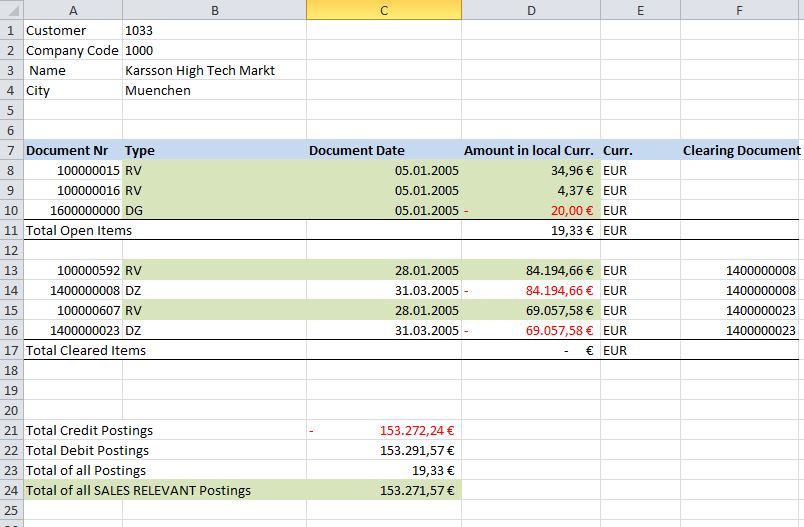
Figure 7 – Reproducing the totals (2)
To reproduce the result, we used a mix of accounting know-how (debit/credit transactions, T-Accounts) and SAP® know-how. We did not discuss every detail: Strictly speaking the document type is not relevant from a technical perspective, as the document type does not determine whether a line item is sales- or payment relevant. In SAP® the so-called “posting key” is far more relevant, if and how a single transaction is treated when building balances, sales- and transaction figures in general (and in particular the customer turnover). This would go too far within the context of these pages, but could be an exciting topic for a future article. Experienced data analysts, who can access SAP® tables, can retrieve technical information from the tables T003 / T003T (document types) and TBSL / TBSLT (posting keys).
However, in context of this article it was important for me to show
- A lot of SAP® reports are very helpful, however also for pre-defined reports Know-How (and/or documentation) is required – not for running it, this is easy, but for interpreting the results.
- Ideally data analysts bring a mix of business process know-how, accounting knowledge, SAP® aspects and audit or data analytic background
Only combining those elements, the full potential of the know-how nested in data can be retrieved.
For any comments on this article, feel free to write us at info@dab-gmbh.de.
To contact the author you can also use LinkedIn or XING (you may have to login first before you can access these links).
LinkedIn: http://de.linkedin.com/pub/stefan-wenig/54/1b8/b30