

Data Analysts with domain knowledge: Telling true stories about your data
This time I would like to take a brief look at an article that my colleague Christoph drew my attention to. It appeared on www.heise.de, authored by Rudolf Jansen, and dated July 7, 2015 at 12:29 h. It is entitled "Data Scientist – ein neues Berufsbild fuer die Big-Data-Welt" [Data Scientist – a New Professional Profile for the Big Data World], and what I like even more is the add-on "Celebrate Data". [Heise]
Reference is made to an article in the Harvard Business Review (HBR) in which "data scientist" is even called "The Sexiest Job of the 21st Century", an article from as far back as 2012. Its authors were Thomas H. Davenport and D.J. Patil, and is also linked here. [HBR]

Figure 1: Are we only looking at data, or do we understand data?
Well, I do not suppose everyone again stuck knee-deep in data would go along with it being so "sexy", confronted with poor data quality, hardware and software constraints, interface problems and supposedly "simple" issues that, when you look more closely, you can turn this way and that like a Rubik's Cube. Nevertheless there is no doubt that the data scientist (or perhaps more generally and with less emphasis on science simply the "data analyst") is set to play a hugely important role.
The first article referred to above tells us that there is still no clear definition. I find the role presented with a relatively heavy onus of information technology/mathematics, with pointers to aspects like NoSQL, machine learning, predictive analytics, R or Python statistics language.
Nothing against that, but for me the following part of the article, quoted here in translation, is interesting:
"Data science = mathematics + information technology + domain knowledge
A data scientist needs (at least) knowledge in two classic subjects: mathematics and information technology. Added to this they will ideally possess knowledge of the particular field of application, because the key task of a data scientist is to find answers to questions, from numerous data sources, that provide the customer (internal or external) with value added for a concrete set of issues." [Heise]
So domain knowledge as part of data science. In the past we published here a guest contribution from Prof. Dr. Georg Herde, detailing the business informatics degree course at Deggendorf Institute of Technology. In my opinion studies are precisely aimed at combining the three aspects of mathematics, information technology and domain knowledge. Personally I would lay more weight on the latter than in the quoted text. I would also reformulate "ideally" as something like "by all means". I think the best analyses, the best data analysts or data scientists, if you like, can be singled out for their solid, profound and extensive domain knowledge. Of course you can argue that many an analytic method sets up on "impartial" information purely immanent to the data (to determine relationships between data/attributes, for instance, that were not known before). Nevertheless, when analyzing everyday business it is a huge advantage to import precisely this domain knowledge. And it is the only way to produce the value added mentioned above for the internal or external customer.
Perhaps this viewpoint is influenced by our way of working, that the analytical approach begins with localization of the data, and does not stop after "tool-supported data analysis", but that the results must also be evaluated and communicated externally. Domain knowledge, for us that is knowledge of business management processes, business-oriented knowledge, and sensitivity for possible risks brought to light by analysis.
Let me illustrate that by a brief example. Assuming the question was "Determine the average credit ratio overall, and the credit ratio per customer". In other words we look at the total credits in the calendar year, and divide it by the total invoices per calendar year. OK, actually a pocket calculator is enough for this purpose, and methods of mathematics and information technology stay within reasonable bounds – but in the example we are concerned primarily with domain knowledge. We assume that the data were localized appropriately in the source system, e.g. in an SAP(R) system in the SAP(R) FI-AR Accounts Receivable module in the tables of the customer subledger. The data were extracted with the relevant fields, imported into analytics software such as ACL(TM), and evaluated with appropriate formulas, calculated fields, functions and commands.
The result in the fictitious example is an average ratio of 8.34% across all customers. This means that we (the company for which the data were analyzed) refund customers on average sums of just under 10%. It may be the result of outline agreements with year-end bonuses if a certain business volume is exceeded, but it can also be caused by returns and complaints. (Strictly speaking, just understanding why there should be credits is domain knowledge.)
Now to look at the ratio per single customer, taking four examples from a total of say 10,539 customers:
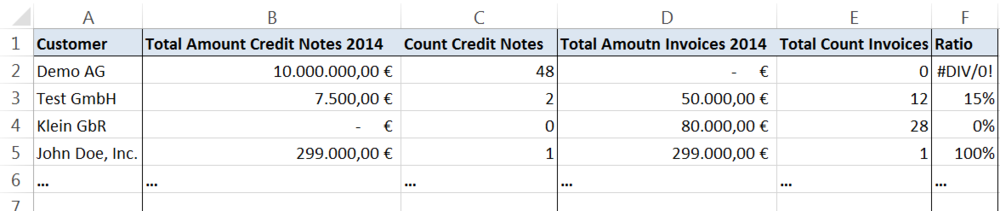
Figure 2: Credit ratio per customer (extract from total result)
- Demo AG has solely credits and not a single invoice in the system. The credits amount to € 10 million. Is that a risk? What could be the reasons?
- Test GmbH seems to be a simpler case, with credits amounting to precisely 15% of the accumulated sum of invoices. Nevertheless, the customer belongs to a group that receives a bonus of 10% on annual business volume, so the determined credit ratio is higher than expected.
- In the case of Klein GbR something seems to be missing, because here there are only invoices in the system and no credits, although it also belongs to the 10% group according to the master data.
- John Doe, Inc. is entirely different to the first three examples, with credits totaling exactly the same as invoices, i.e. € 299,000.
Of course there can be a number of different reasons for one case or another. Here is the answer:
- Demo AG is an association of purchasers, in other words the goods are received by the customers belonging to the association. This is where the invoices are to be found. That is also the case with the data set in line 4, Klein GbR, and is precisely the reason why no credits are shown. These, just like the credits of all other companies belonging to the purchasers association, are credited to the association at the end of the calendar year, which then administers and distributes them centrally.
- Test GmbH is a simpler case. This is a customer that has a 10% bonus agreement with us. Annual business volume was achieved, the bonus paid out. But why 15% credit ratio? A look at detailed data (= single transactions) shows that an additional credit was issued because a delivery of goods was in part damaged during transport. This could have been separated in analysis from the start by the reference to the sales document.
- What strikes you in the case of John Doe, Inc. is the fact that there is exactly one invoice against which exactly one credit was posted. These transactions should possibly be looked at more closely. Were turnover figures to be "polished up" at the end of a period (possibly relevant for criteria of achieving a target) that were then canceled in the next period? Or was there risk of a default on payment so that the invoice was canceled by a credit because the goods were taken back? Information from another SAP(R) module like SD Sales & Distribution would be helpful.
These are possible stories at the back of the individual results. A pure "listing" of the results of analysis is obviously not enough. One point that I would speak of here and that does not yet come out too clearly in the articles mentioned is how data scientists and data analysts see themselves, and the role they play in a company. Should they only deliver the result of analysis, as in the example "Determine the average credit ratio overall, and the credit ratio per customer", which is then to be assessed by others? Or should their task rather be to create an analysis, to view and assess the results, to differentiate and communicate, and subsequently to refine and elaborate an analysis iteratively in the context and domain of the particular analysis?
That is the line of thought of the article in [HBR], saying straight away in the introduction "More enduring will be the need for data scientists to communicate in language that all their stakeholders understand – and to demonstrate the special skills involved in storytelling with data…". [HBR]
Storytelling with data, a very important point for the sustainability of this profession, built on a bridge of domain knowledge.
The way I see it – getting back to the "Sexiest Job of the 21st Century" in [HBR] – only the integral approach can create a really fulfilling and satisfying activity. Of course the example here is not one for which you require mathematical/statistical methodology. Which should not be misunderstood as meaning that they are not extremely important in "data science = mathematics + information technology + domain knowledge". But good data analysis starts with the nitty-gritty, and with readiness to see the substance of the data, to know and learn your own data and processes, and constantly scrutinize the results and thus to learn more: "Celebrate Data" as Jansen puts it so appropriately in [Heise]. An important part of the overall picture is the domain knowledge exemplified here. If you are working in data analytics yourself or looking for data analysts/data scientists – ask for domain knowledge. By all means.
For any comments on this article, feel free to write us at info@dab-gmbh.de
To contact the author you can also use LinkedIn or XING (you may have to login first before you can access these links).
LinkedIn: http://de.linkedin.com/pub/stefan-wenig/54/1b8/b30