

ACL AN Script Editor with Break Points - Walktrough
In this blog post I want to focus on the new script editor features of ACL™ Analytics 10 For creating the screenshots the English version 10.5.0.172 was used. I don’t want to talk too much about scripting or the scripting language of ACL™. From my point of view, it is really great. Though it looks quite easy to handle and self-explaining when you read through the code, it allows you to perform complex tasks with it. Over the years we developed hundreds and hundreds of analytic routines, audit steps and tests for SAP© data with that scripting language, and we were able to do very cool things with it. However, one of the downsides of the past had been the quite old-fashioned script editor. Usability was not good, not to mention the missing colors or the lack of functionality of the editor. Finally this changed. ACL™ Analytics now offers color coding, line numbering and last but not least the option to set break points or go through your scripts step-by-step. I put together some screenshots for you how this looks like. At the end of this article, I stated some pros and cons that came to my mind during testing.
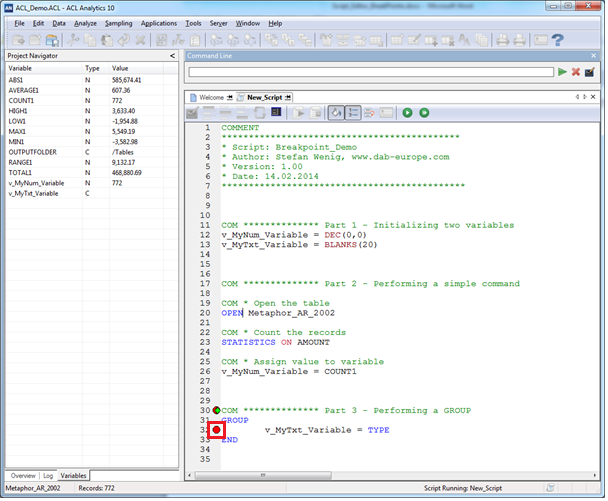
Here is the script I used for testing.
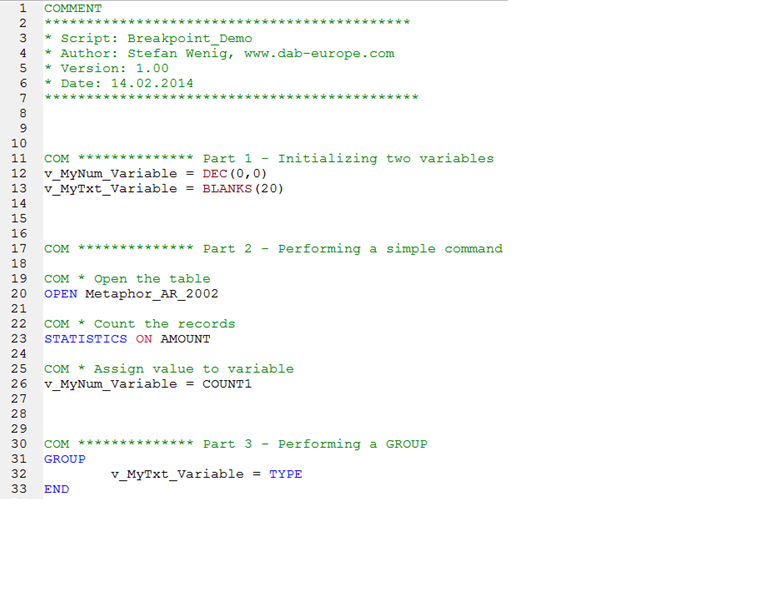
I left aside any business aspect, so it is not sophisticated and on rather technical level. The only purpose is to show the break point elements. I initiate two variables, one containing data type “Numeric”, one containing data type “Character”. Then I open a table and run a command to it. One of the commands results (here it is the total amount of the Amount-column) gets assigned to the numeric variable. Later on, a GROUP command is performed; within that GROUP, the document type gets assigned to the Text-Variable. So we start with the script which is in our ACL™ project. I can start it by pushing the green “Play” button:

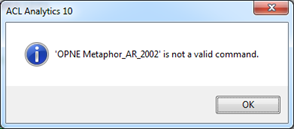
As you may have spotted already when looking at screenshot 1, I did – only for demonstration purposes of course ;-) – a typo in the OPEN command. It says “OPNE”. As expected, ACL™ stops, giving an error message.
What is new is that the script editor now immediately indicates where the error happened: It brings in a little red arrow on that line where the problem occurred.

This is already a good one, because some of our scripts (dab:FastForwards) do have ten thousand lines of code. It is very helpful to see at least where it stopped. So after correcting it, I rerun it and it gets performed without any problem. What you may have noticed that there is an additional tab on the left-hand-side where the project navigator is. It is labeled “Variables” and contains a list of all currently active variables.
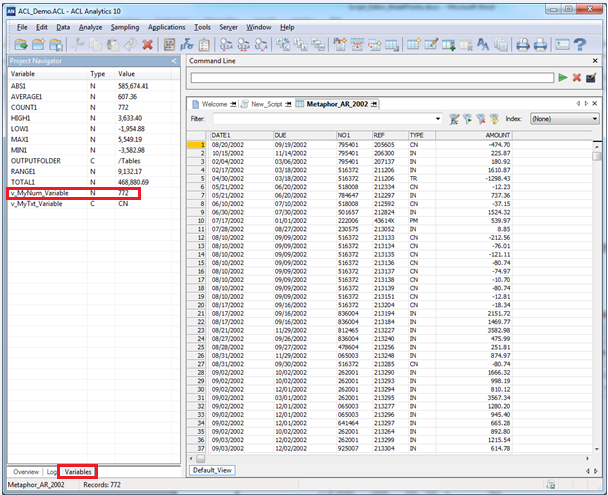
After the script run, variable “v_MyNum_Variable” has the value “772”; v_MyTxt_Variable contains “CN”. Now let’s use the debugger to go through step by step. I deleted all variables to start from scratch. A green arrow indicates the position where which line will be processed next.
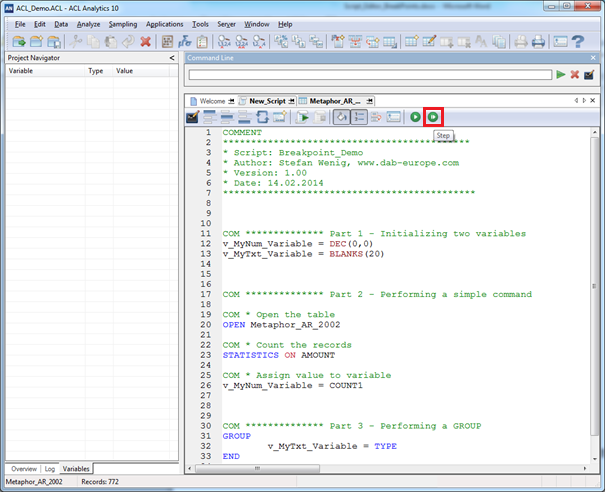
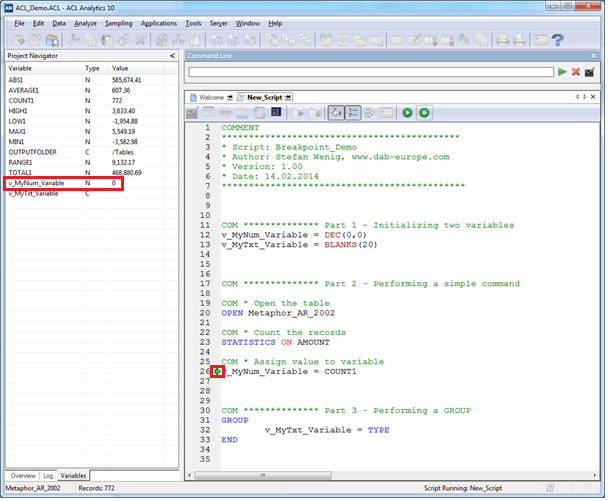
Clicking on “Step” allows you to go through the script step by step. Once it passed the line “v_MyNum_Variable = DEC (0,0) , the variable appears on the left hand side and gets initialized with 0.
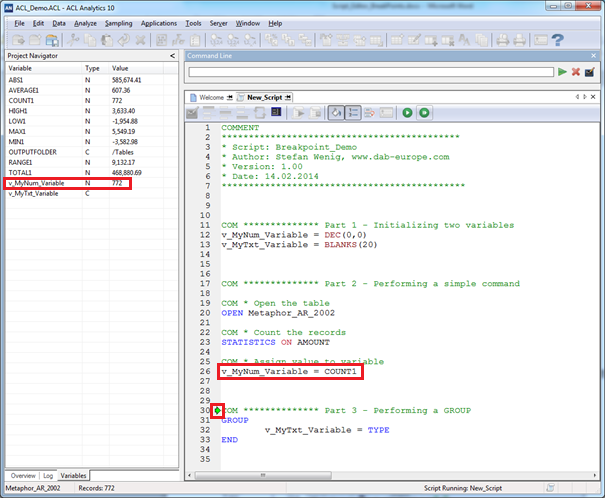
STATISTICS COMMAND created a lot of variables in the background. All of them are visible on the left hand side after passing that line of code. v_MyNum_Variable is still 0 though. But after passing the line “v_MyNum_Variable = COUNT1” the proper value 772 gets assigned to the variable.
Now I am continuing pressing “Step” to debug the GROUP as well. However ACL™ did not allow me to do so, once passing GROUP the script was finished, and I was not able to debug the GROUP command. Let’s try a second approach: Instead of going through step by step using the STEP-button, you can set break points by left-clicking at the line of code where you want to stop. This absolutely makes sense of course, as you do not want to click 10.000 times on “STEP” if you have a huge script. A red dot indicates where the break point is (or where the break points are, there are more than one break point possible).
First test, let’s set a breakpoint before the GROUP:
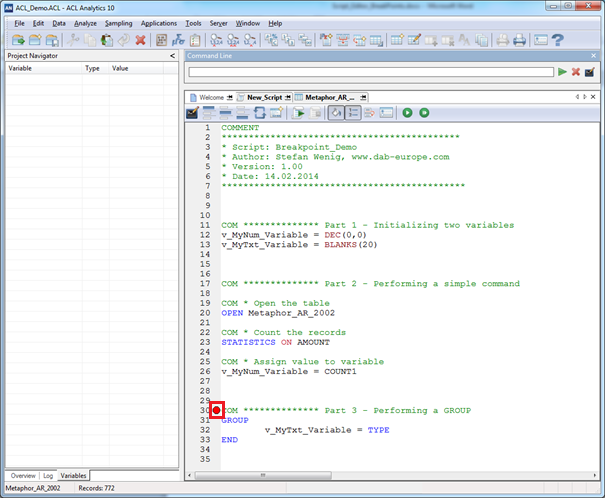
The red point indicates the break point. Now when running the script, it stops as expected. A green arrow appears, and I can see the currently populated variables on the left hand side, including their values.
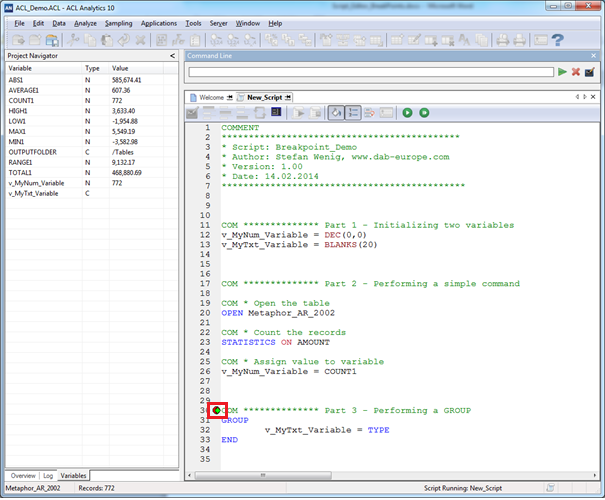
Now I want to try to step into that GROUP by setting a break point within that GROUP.
However when pressing “RUN”, it does not stop; it runs through without any message.

So the debugging including break point works, but (again, just like the step-through) not within the GROUP command. As a side note, I tested to use the command line while debugging a script. When I tried, the following message occurred:
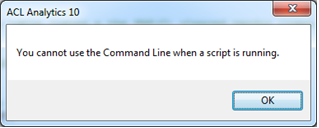
So the command line cannot be used while debugging a script.
Bottom Line:
- The script editor of ACL 10 is very useful. It was about time to get line numbering and color coding for the code, and it is a great help for any ACL™ programmers out there.
- Having the additional “Variable” navigator on the left hand side is very useful as well: In combination with the debugger, it makes script development a lot easier.
- For debugging, you can go step-by-step through your scripts, and/or set break points within the code.
- ACL Indicates where it stopped if an error occurred.
- Two thing that I personally miss, but this is probably the “Tecci” in me:
- Currently it is not possible to use the command line when debugging a script. I understand the reasons (you could mess around too much, delete all variables etc.), but I kind of missed it anyway – but this may only be me. :-)
- As second point I would have loved was to be able to debug within a group. Very often this is the tricky part when coding: To control your variable content when performing a group.
But I do not complain, in fact I am happy about the new functionality. All in all it is a big improvement, and if you want to write ACL™ scripts, and you do not have it yet, you should definitely consider updating to ACL™ AN 10.5 to get these features.
I hope you enjoyed this little walkthrough! For any comments on that article, feel free to write us at info@dab-gmbh.de
To contact the author you can also use LinkedIn or XING (you may have to login first before you can access these links).
LinkedIn: http://de.linkedin.com/pub/stefan-wenig/54/1b8/b30